Trusted by 9+ million people and over 10,000 companies
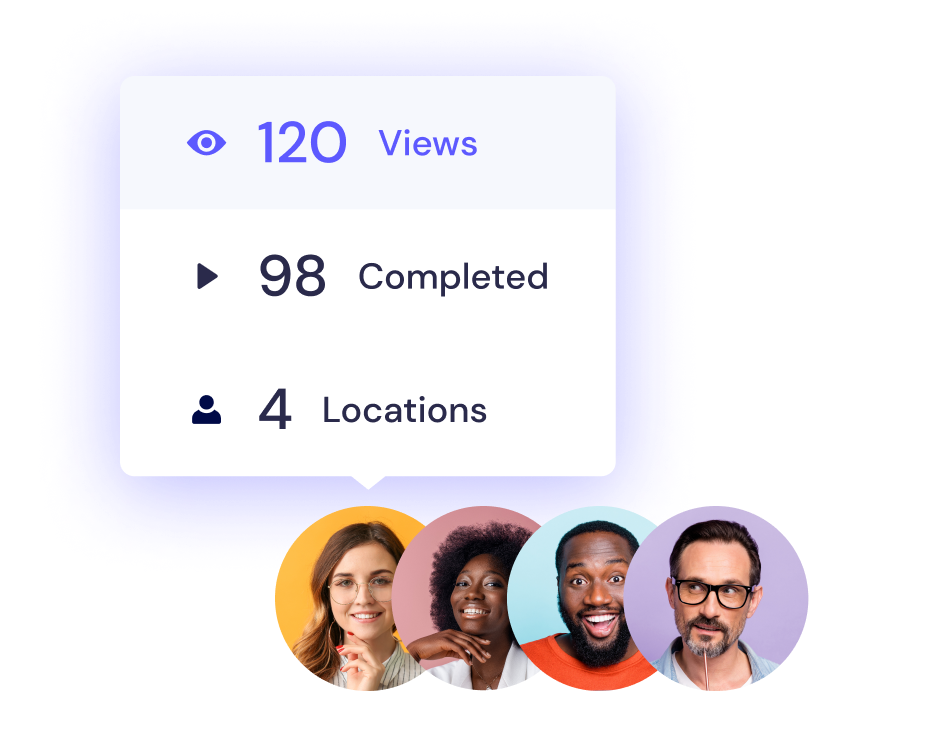
Know what works and what doesn’t with real-time analytics
Measure how far your message reached with real-time viewer, engagement, and location analytics. Know what works and tweak what doesn’t for even more effective videos.
0
Views
0
Completed
0
Locations
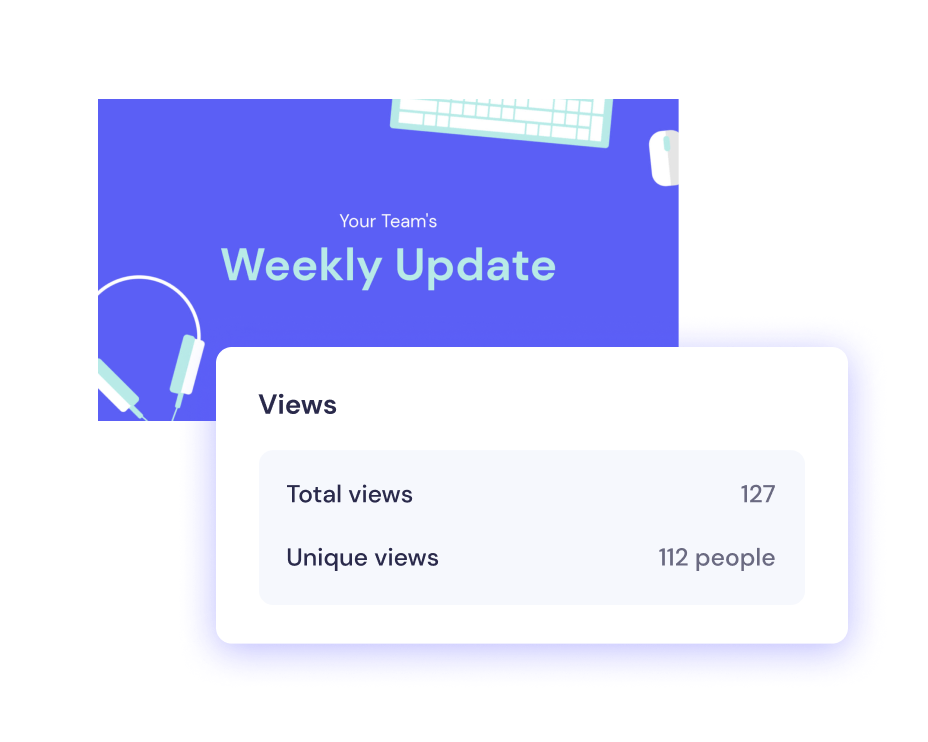
Track your view count
Curious if video is as powerful as we’ve been saying it is? See for yourself with viewer analytics. Filter between all-time views, just this month, or just this week for more in-depth info.
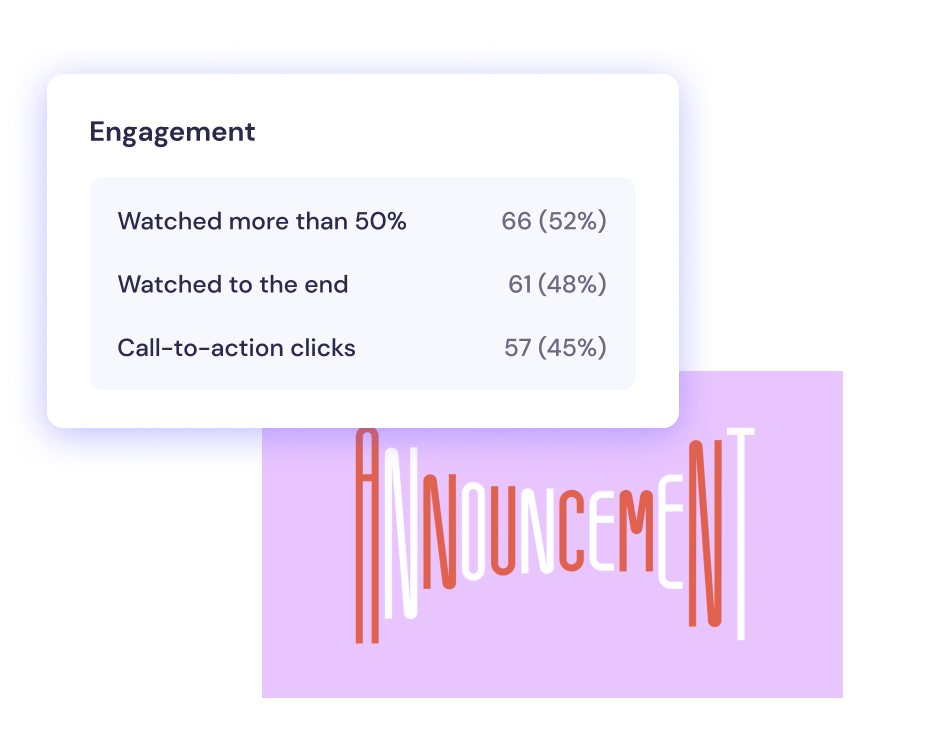
Monitor engagement
Know if your whole message is getting through or if you’re losing attention spans halfway through. Engagement analytics let you know who watched your whole video, who dropped off early, and how many people clicked on your CTA.
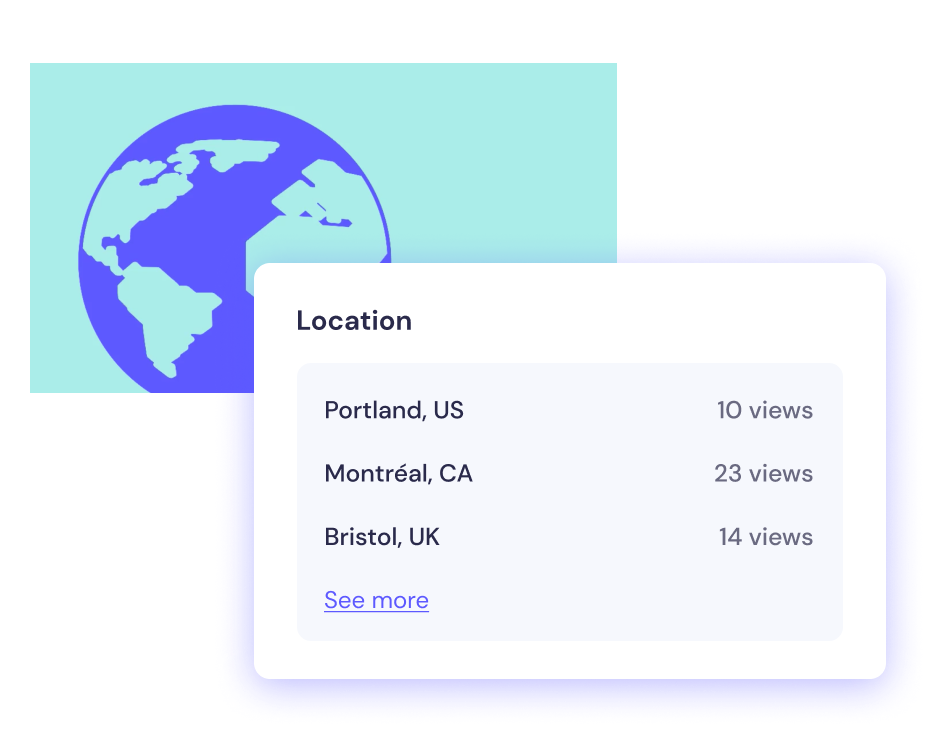
Zoom in on viewer locations
Location analytics track the cities of your viewers. Watch your video travel the globe and see which offices need a nudge.
“We try to use Biteable as much as possible…Videos are appreciated more than static messages.”