YouTube is growing. In 2019, the number of channels ballooned by over 25%. And as far as numbers go, there are 15 million creators that upload 80 million videos each month.
If you’re a YouTuber, or trying your hand at video marketing, it’s clear that competition is heating up. Today, to rank your videos above the competition’s, you need to know which metrics matter and how to create videos that users love.
In this post, I’ll share the top 10 metrics that all YouTubers and video marketers should be focusing on to generate the best possible results. I’ll define each metric, share why it matters, and explain what you can do to make these metrics work in your favor.
First, let’s get clear on what YouTube requires to rank your content above the rest and to recommend your videos to other users.
What YouTube wants from creators
YouTube wants more people to watch more videos for longer. And to achieve this, YouTube has designed an algorithm that incentivizes creators who attract and hold viewer attention.
But, what does that mean?
In clearer terms, while your videos are what people watch, YouTube’s algorithm watches users. As they consume content, the platform develops user profiles. It measures how much of your videos are consumed, how regularly they are watched, along with a host of other factors.
10 YouTube metrics that matter
Thinking about how YouTube observes users is the key to producing stronger content and better results for your channel and viewers.
The easiest way to understand how these metrics are linked to what YouTube requires to rank your content is to use what I like to call the “Viewer Consumption Cycle”. The viewer consumption cycle is broken into three phases. They are:
- Attraction. Metrics that are related to attracting viewers.
- Consumption. Metrics that track viewers and the way they consume your videos.
- Reaction. Metrics that track how viewers respond to your videos.
As you can see, attraction leads to consumption and consumption to a reaction, and the cycle repeats itself.
For example, when viewers see a catchy title and thumbnail you’ve published, that’s the attraction phase in action. When they click on your video and watch it, that’s the consumption phase. The reaction phase includes how long they watch the video for, whether they like and share it, and more.
Together, these metrics are collated and analyzed by YouTube. Let’s dive into each phase and metric.
Attraction metrics
Attraction metrics indicate how well your videos pull viewers in. These include traffic sources demographics, impression click-through rates, and views per unique viewer.
Lorem ipsum dolor sit amet, consectetur adipiscing elit. Ut elit tellus, luctus nec ullamcorper mattis, pulvinar dapibus leo.
1. Traffic sources
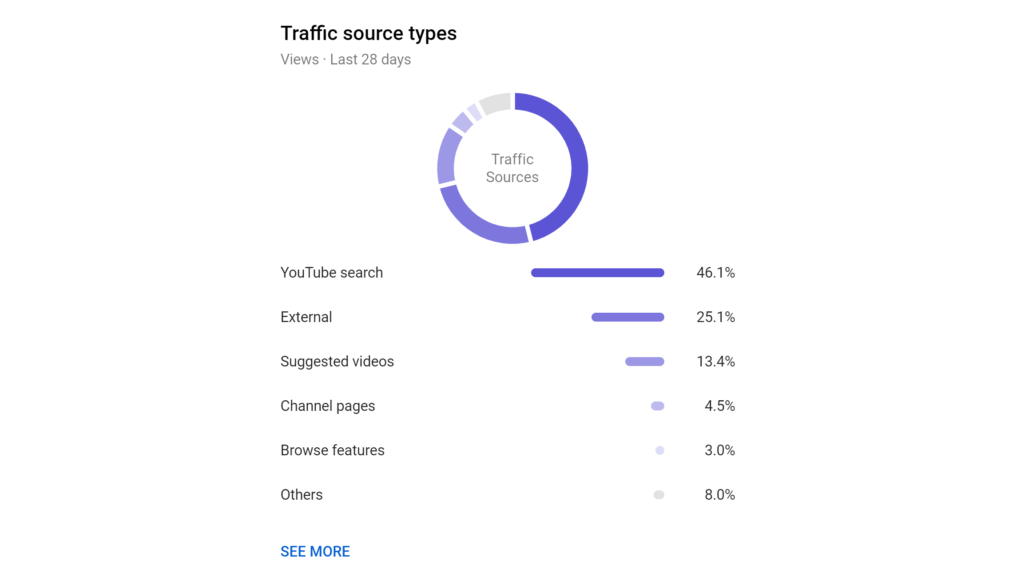
Traffic sources are all the places where your YouTube videos pull viewers from. While there are many, these three statistically drive more traffic than all others:
- Search. These are viewers who find videos via the search bar. The more people that find your video, the more views you are likely to get.
- Suggested Views. Traffic from videos that appear alongside the video a viewer is watching and, usually, are next in the autoplay playlist. “Suggested View” videos are also a great source of more video views.
- Browse. These are videos that appear on a user’s home page. YouTube will show your video to a small audience that’s shown interest in your content within the last seven to 28 days. The more people watch your videos, the more they’ll see your content on their home pages.
How to improve your videos using traffic source
Getting your videos to appear in search, suggested views, and be shared with your audience involves optimizing your content. While there are tons of information out there about how to optimize yours, here are three of the most important:
- Create strong, benefit-focused video titles
- Front-load your titles with keywords
- Include keywords in your description
The great news about using these three tips is that while they all appear to apply to search traffic, they affect each of the traffic sources above. Well-optimized videos rank, and the better they rank, the easier it is for them to be seen.
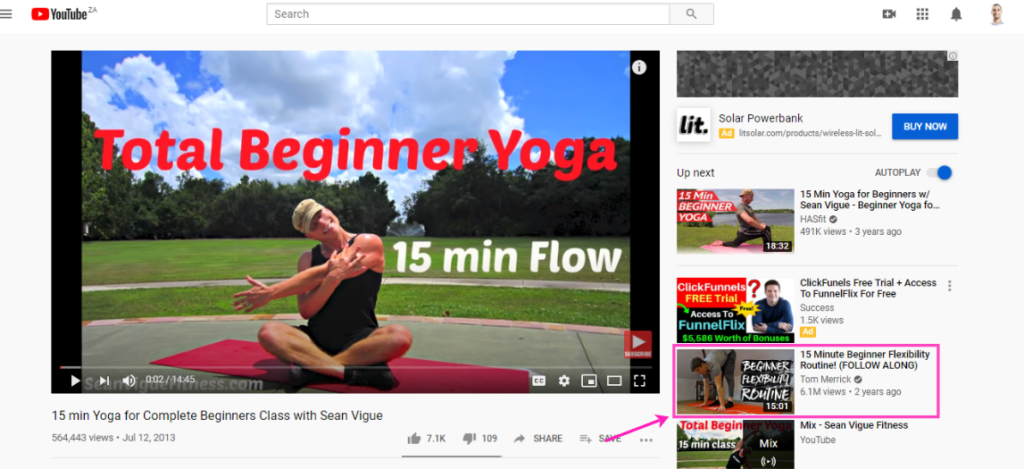
In the example below, Tom Morris’s video appears in the autoplay playlist because it’s optimized with the keywords “beginner yoga”.
2. Impressions click-through rate
“Impressions click-through rate” measures how often a viewer watches a video after seeing an impression on YouTube. It’s a big deal for creators, too. If you get tons of traffic and impressions to your videos, but hardly any clicks, your video thumbnails, and titles may not be attracting your core audience.
On the other hand, if you get tons of clicks but have a low average view duration, users may see your content as clickbait.

How to improve your videos using “impression click-through rate”
Like all things in the YouTube ecosystem, improving your “impression click-through rate” is linked to other metrics. Here are two ways to improve yours:
Understand how your videos are performing
“Impression click-through rate” does a great job of pointing to where to improve your videos. Take the two instances mentioned above. High click-through rates and low average view duration or AVD (more on AVD later) mean that people feel baited by your titles and thumbnails.
To fix this, improve your titles and thumbnails by hinting at what viewers stand to gain from your videos and keep it factual.
For low click-through rates and high average view durations, get more specific with your titles and thumbnails. Create stronger copy and more engaging thumbnails.
GaryVee’s video grabs attention for a couple of reasons. First, the thumbnail stands out with bright neon-green text. Second, after seeing his thumbnail, looking at his video title you easily see the value you’ll receive by taking the time to watch it.

Pay attention to data
“Impression click-through rate” is also linked to traffic sources and demographics (more on this later). Traffic sources show you where traffic comes from and demographics point to who’s watching your content. When you understand both, you can start improving aspects of your videos (think titles, thumbnails, and content ) to be more aligned with your core audience.
3. Average views per viewer
“Average views per viewer” indicates how many times a viewer watches your videos on average. As your videos generate more unique viewer views, this signals better engagement to YouTube. And because YouTube pays attention to user behavior to make recommendations, your content can start to see a bump in rankings.
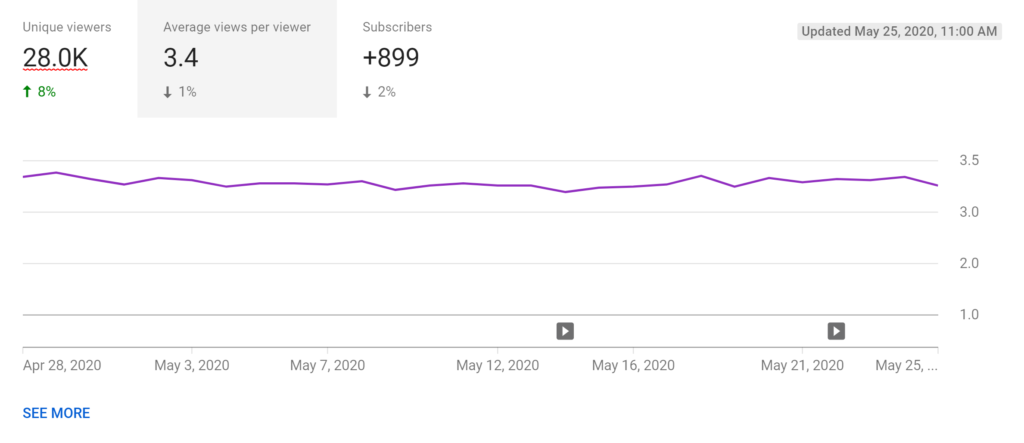
How to improve your “views per unique user“
Users are attracted to great content that’s optimized for clicks. That said, the number of views you generate per unique user is also influenced by content topics you create videos for, and who those videos are targeted at.
Start by paying attention to which topics help you increase the number of views for each user. Next, refer back to your core audience profile and use what you’ve found to generate more great content ideas that are aligned with your audience. It may take a little testing to perfect this process, but once you’ve got a handle on it, you’ll begin to see a boost in views on YouTube.
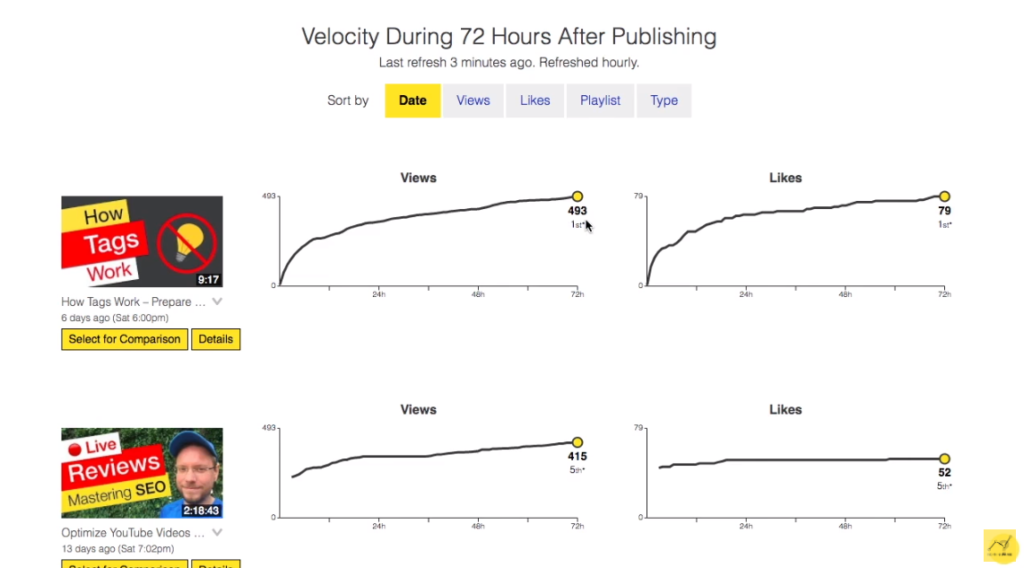
MorningFame used the method above to create a video that shot to first place on their channel.
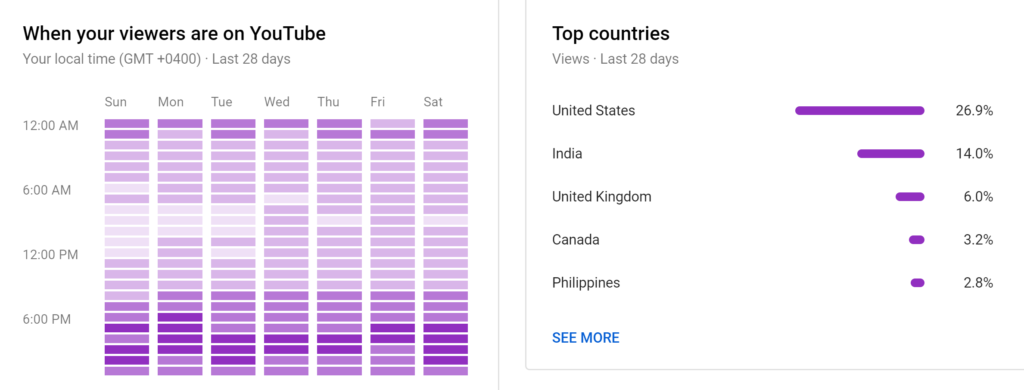
4. Demographics
Demographics are a peek at your audience. While you don’t get details on exactly which users are spending time watching your videos, you still get loads to work with. You can tell where your audience comes from, their gender, age, and ultimately understand who your videos are attracting.
How to improve your videos using demographics
Demographics are at the heart of what it takes to build an audience. The more you know about who you’re creating videos for, the easier it becomes to create more content that they are interested in.
If you’ve struggled to get a handle on who your audience is, here are three steps to help you get clarity:
- Look at which videos get the most views, along with the genders, age groups, and viewer locations to understand who watches your content.
- Pay attention to your video titles and content to see what attracts your audience.
- Once you’ve identified which videos and topics get the most attention, and where your views come from, build a persona that clearly defines who your core audience is.
Defining your core audience is important. You may feel that it limits your reach but it shouldn’t. There are two billion monthly active users on YouTube, that’s a third of the internet, so there’s more than enough people to reach.
Also, creating content that’s too broad can hurt your audience growth. By playing to who your audience is, you can lean into the momentum your channel has already has and grow it further.
Consumption metrics
While consumption metrics vary, you’re able to improve each metric by applying the same tips and tactics. It’s important to know that consumption is all about holding the attention of your audience, whether you’re focused on YouTube channel growth or monetization.
In the section, we’ll look at the “average percentage viewed”, “average view duration”, “audience retention”, and “watch time from subscribers” before sharing two powerful tips to help improve your results.
5. Average percentage viewed (APV)
“Average percentage viewed” is a measurement of how much of a video users have watched on average. This metric is especially important as YouTube uses it to gauge how well your videos hold the attention of its users.

6. Average view duration (AVD)
“Average view duration” is, in practice, quite similar to “average percentage viewed”. This metric represents the total watch-time of a video divided by the number of video plays (including replays) your video gets.
How does this influence your video’s performance? The lower your “average view duration”, the less likely YouTube is to position your videos above competitive content with better average view durations.

7. Audience retention
“Audience retention” shows you when viewers consume and leave your videos. Audience attention is measured as a percentage and is a powerful metric because it tells you exactly when viewers lose interest in your content, helping you identify what to change or work on to boost their retention value.

8. Watch time from subscribers
“Watch time from subscribers” indicates how much time all users subscribed to your channel spend on your videos. As you can imagine, a higher percentage indicates that the videos you create are appreciated by your audience. Conversely, the lower the watch time, APV, and AVD, from subscribers, the clearer it becomes that your videos may not be delivering the kind of value you expect them to.
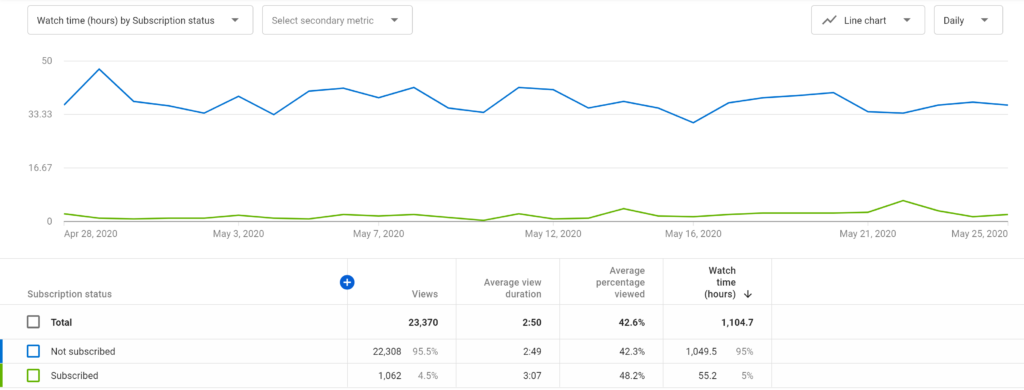
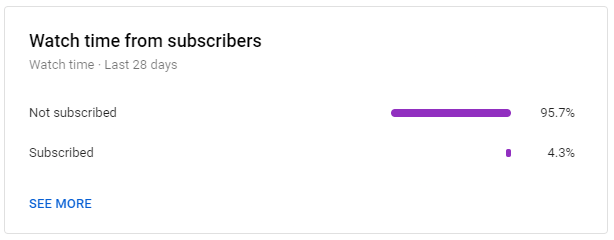
“Watch time from subscribers” also shows a percentage of watch time for people not subscribed to your channel. These are users who found your content through recommendations or in search. As with the “watch time for subscribers”, high is good, and low is bad.
Given the way YouTube content is distributed, you’ll always see a higher watch-time for non-subscribers, as shown in the case below. Non-subscribers represent an opportunity to refine elements of your videos. For example, designing a more specific thumbnail will target a specific kind of user, leading to a higher “impression click-through rate”. You can also improve your video’s pacing and call-to-action to entice some of those non-subscribers to subscribe to your channel.
How to improve your consumption metrics
Grabbing and holding your audience’s attention may seem like a tall task, but it is possible. Here are two highly-effective methods you can use to boost your consumption metrics.
Tell stories
Stories are as old as time and they are at the heart of every successful marketing endeavor. They’re also the reason why people log onto YouTube. Users want to learn something or be entertained, both of which can only be done through great storytelling.
Storytelling isn’t a difficult skill to master. All stories are broken up into three parts:
- Introduction. The characters and a problem or challenge they are experiencing.
- Body. The problem or challenge in detail, along with a solution.
- Conclusion. A review of what the characters experienced and the lessons learned to empower the viewer.
If you follow the simple three-part approach, your videos will be more engaging and easy to follow for your audience.
Create videos that drive action
Activate your audience with impactful, on-brand videos. Create them simply and collaboratively with Biteable.
Use “pattern interrupts”
A “pattern interrupt” is the introduction of a new idea, one that creates intrigue and triggers your viewer to pay attention. “Pattern interrupts” were identified in the study of neurolinguistic programming. They work because of the nature of the human mind. When a new idea is suddenly introduced, the mind can’t help but latch onto it to almost see how far the rabbit hole goes.
While patent interrupts may sound complex to implement, they can be as simple as introducing a graphic while you’re explaining a concept, changing the camera angle in editing, or switching between full and close-up shots at different points of your video’s timeline.
Reaction metrics
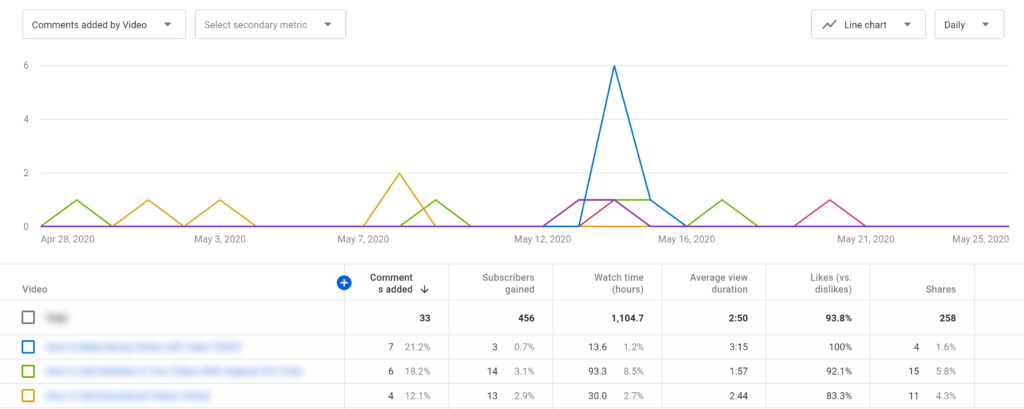
Reaction metrics are often the first metrics that YouTube users pay attention to because they appear on the frontend of the platform. In this section, we’ll look at engagement and recommendations, and how you can improve both to positively influence how YouTube positions your videos.
9. Engagement
Subscribers, likes and dislikes, comments, and shares are some of the strongest indicators of a channel’s success. They can be used to identify which topics in your content library were received positively, and how to improve everything from the topics featured to messaging, and even content depth.
10. YouTube video recommendations
While “YouTube video recommendations” are more related to how YouTube chooses to prioritize your video content, it’s important to remember that YouTube is more interested in watching its users. And this is why quality content is so important.
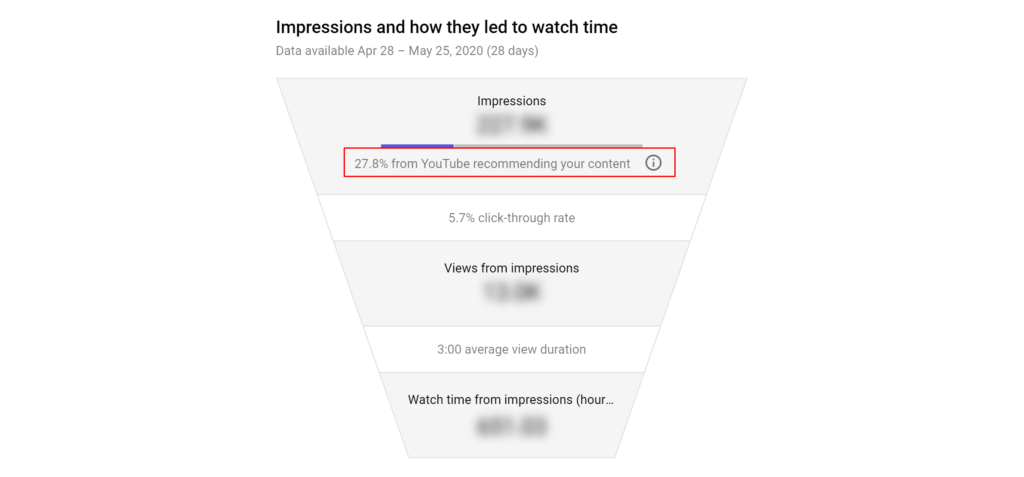
YouTube recommendations are based on a combination of all of the above metrics. As mentioned earlier, as more users interact with your content, the more data YouTube is able to gather as it creates user profiles.
User profiles tell YouTube what viewers like clicking on, what they like watching, and how engaged they are through their actions, like liking (or disliking), commenting, and sharing.
How to boost your reaction metrics
To improve your reaction metrics, you have to focus on creating content that users truly appreciate. Having shared how to attract and hold the attention of your target audience, here are two important tips for creating highly-effective YouTube videos:
Go deep
Today, creating quality content that makes audiences happy means exploring concepts. It’s not enough to scratch the surface of an idea or offer unsubstantiated statements. You have to produce videos that offer something unique and the best way to do so is through solid research.
Take the time to find questions that your audience has about a specific topic and what the common misconceptions are about it, too. Look for examples that illustrate your point to make your videos more compelling. While it will take longer to thoroughly research a topic, your videos will be more engaging.
Dig into data
There’s no creating amazing content without understanding how your channel is performing. This is why it’s so crucial to dig into the data you have at your fingertips. While YouTube offers tons of insights and analytics, you have to pull them together to tell the story of your channel and what users are responding to.
But don’t stop at just metrics, look at what your common section includes and ask questions of your viewers. Doing both adds a qualitative approach to how you interpret your channel’s performance
Takeaway
YouTube analytics can be used to tell an insightful story about your video success rate. But you need to keep the fundamentals in mind. YouTube wants people to find what they are looking for and it wants them to watch more videos for longer. If you pay attention to what your audience is looking for and watching more of, you’ll be able to leverage data to create more successful videos.
- About the author
Amir Shahzeidi, Digital Marketing Manager
Amir Shahzeidi is the digital marketing manager at Uscreen, an all-in-one video monetization and OTT platform provider. Unscreen empowers video entrepreneurs and creators to monetize their content and build thriving businesses around their videos.

